
Temperature Conversion Chart
Quick-reference temperature conversion chart. The tables below compare the most common units side by side. Download the free PDF for offline and printable use.
Standards and method
Values are calculated from the shared conversion-factor library. Exact defined relationships are preserved; displayed results are rounded only for readability.
Maintained by Miguel Coelho. Updated . See our editorial policy.
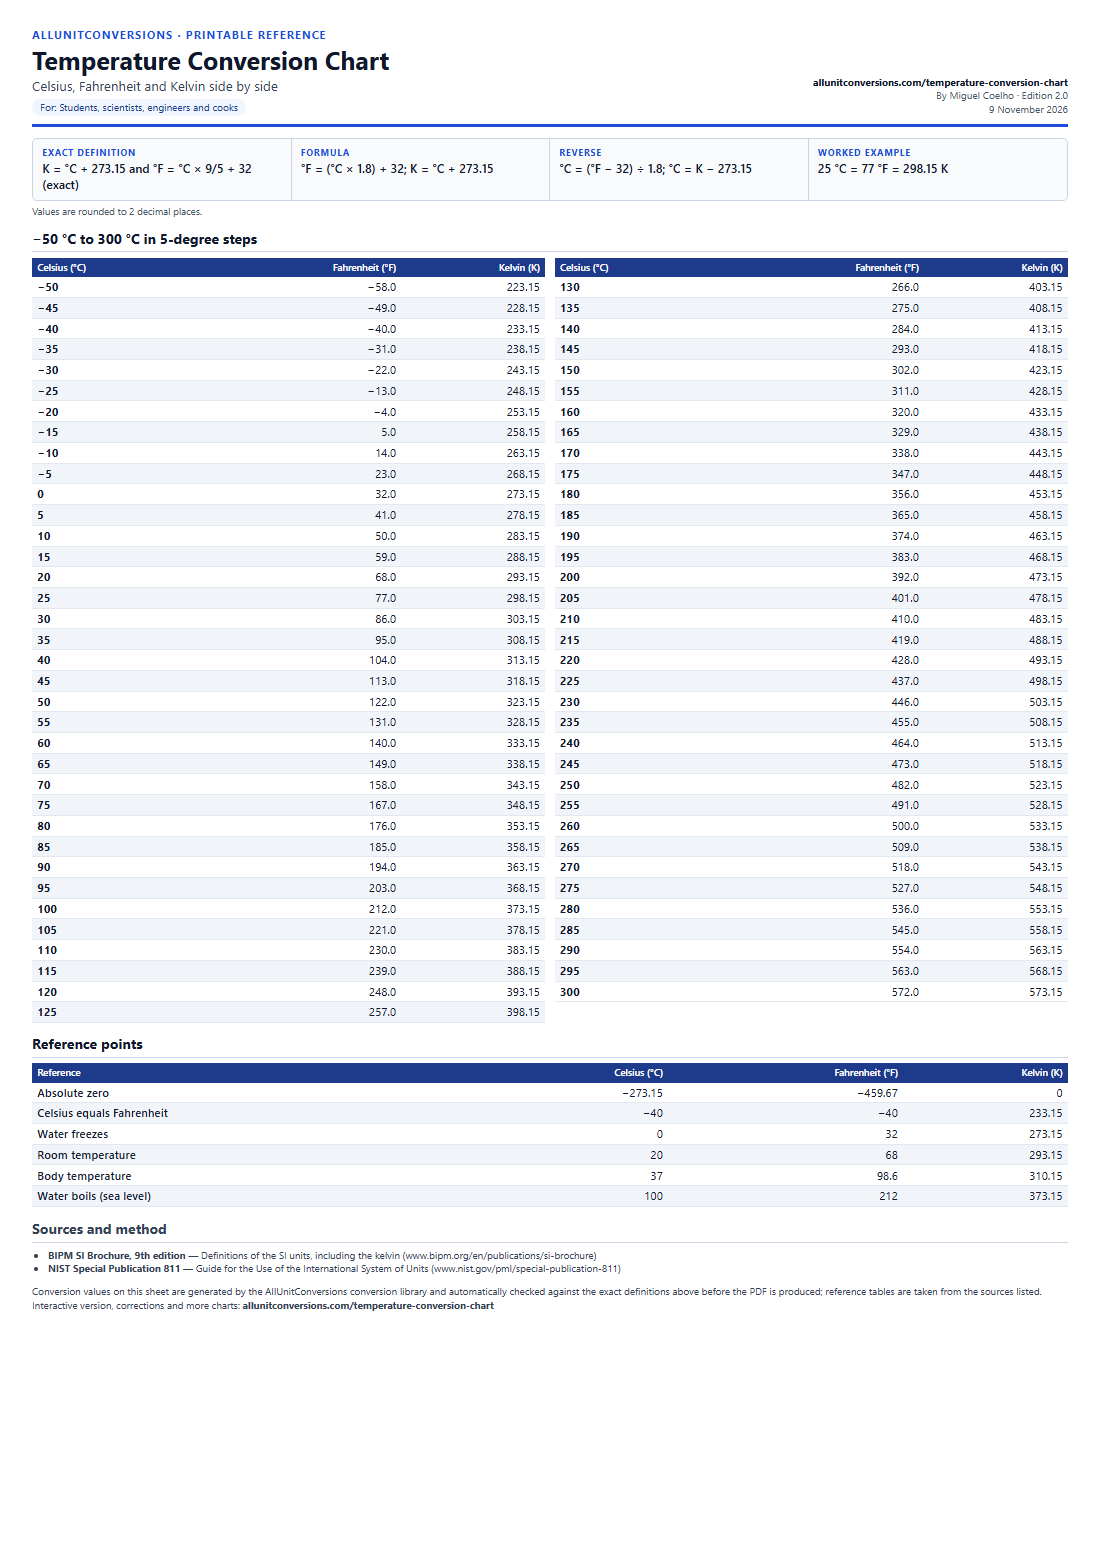
Printable temperature conversion chart
Celsius, Fahrenheit and Kelvin side by side. Includes the exact definition, formulas, a worked example and sources. Conversion values are checked against the defining constants, and reference data is cited to its source, before the PDF is published.
Free to print, share and use in teaching materials with attribution (CC BY 4.0).
Also in these packs: Pipe and Plant Engineering Reference Pack, HVAC and Refrigeration Reference Pack, Pilot Reference Pack, Classroom Unit Conversion Pack (related sheets in one PDF).
Full temperature conversion chart
Celsius, Fahrenheit and Kelvin side by side. These are the same tables as the printable PDF. For: Students, scientists, engineers and cooks.
- Exact definition
- K = °C + 273.15 and °F = °C × 9/5 + 32 (exact)
- Formula
- °F = (°C × 1.8) + 32; K = °C + 273.15
- Reverse
- °C = (°F − 32) ÷ 1.8; °C = K − 273.15
- Worked example
- 25 °C = 77 °F = 298.15 K
- Rounding
- Values are rounded to 2 decimal places.
−50 °C to 300 °C in 5-degree steps
| Celsius (°C) | Fahrenheit (°F) | Kelvin (K) |
|---|---|---|
| −50 | −58.0 | 223.15 |
| −45 | −49.0 | 228.15 |
| −40 | −40.0 | 233.15 |
| −35 | −31.0 | 238.15 |
| −30 | −22.0 | 243.15 |
| −25 | −13.0 | 248.15 |
| −20 | −4.0 | 253.15 |
| −15 | 5.0 | 258.15 |
| −10 | 14.0 | 263.15 |
| −5 | 23.0 | 268.15 |
| 0 | 32.0 | 273.15 |
| 5 | 41.0 | 278.15 |
| 10 | 50.0 | 283.15 |
| 15 | 59.0 | 288.15 |
| 20 | 68.0 | 293.15 |
| 25 | 77.0 | 298.15 |
| 30 | 86.0 | 303.15 |
| 35 | 95.0 | 308.15 |
| 40 | 104.0 | 313.15 |
| 45 | 113.0 | 318.15 |
| 50 | 122.0 | 323.15 |
| 55 | 131.0 | 328.15 |
| 60 | 140.0 | 333.15 |
| 65 | 149.0 | 338.15 |
| 70 | 158.0 | 343.15 |
| 75 | 167.0 | 348.15 |
| 80 | 176.0 | 353.15 |
| 85 | 185.0 | 358.15 |
| 90 | 194.0 | 363.15 |
| 95 | 203.0 | 368.15 |
| 100 | 212.0 | 373.15 |
| 105 | 221.0 | 378.15 |
| 110 | 230.0 | 383.15 |
| 115 | 239.0 | 388.15 |
| 120 | 248.0 | 393.15 |
| 125 | 257.0 | 398.15 |
| Celsius (°C) | Fahrenheit (°F) | Kelvin (K) |
|---|---|---|
| 130 | 266.0 | 403.15 |
| 135 | 275.0 | 408.15 |
| 140 | 284.0 | 413.15 |
| 145 | 293.0 | 418.15 |
| 150 | 302.0 | 423.15 |
| 155 | 311.0 | 428.15 |
| 160 | 320.0 | 433.15 |
| 165 | 329.0 | 438.15 |
| 170 | 338.0 | 443.15 |
| 175 | 347.0 | 448.15 |
| 180 | 356.0 | 453.15 |
| 185 | 365.0 | 458.15 |
| 190 | 374.0 | 463.15 |
| 195 | 383.0 | 468.15 |
| 200 | 392.0 | 473.15 |
| 205 | 401.0 | 478.15 |
| 210 | 410.0 | 483.15 |
| 215 | 419.0 | 488.15 |
| 220 | 428.0 | 493.15 |
| 225 | 437.0 | 498.15 |
| 230 | 446.0 | 503.15 |
| 235 | 455.0 | 508.15 |
| 240 | 464.0 | 513.15 |
| 245 | 473.0 | 518.15 |
| 250 | 482.0 | 523.15 |
| 255 | 491.0 | 528.15 |
| 260 | 500.0 | 533.15 |
| 265 | 509.0 | 538.15 |
| 270 | 518.0 | 543.15 |
| 275 | 527.0 | 548.15 |
| 280 | 536.0 | 553.15 |
| 285 | 545.0 | 558.15 |
| 290 | 554.0 | 563.15 |
| 295 | 563.0 | 568.15 |
| 300 | 572.0 | 573.15 |
Reference points
| Reference | Celsius (°C) | Fahrenheit (°F) | Kelvin (K) |
|---|---|---|---|
| Absolute zero | −273.15 | −459.67 | 0 |
| Celsius equals Fahrenheit | −40 | −40 | 233.15 |
| Water freezes | 0 | 32 | 273.15 |
| Room temperature | 20 | 68 | 293.15 |
| Body temperature | 37 | 98.6 | 310.15 |
| Water boils (sea level) | 100 | 212 | 373.15 |
Sources for this chart
Conversion values on this sheet are generated by the AllUnitConversions conversion library and automatically checked against the exact definitions above before the PDF is produced; reference tables are taken from the sources listed.
- BIPM SI Brochure, 9th edition — Definitions of the SI units, including the kelvin
- NIST Special Publication 811 — Guide for the Use of the International System of Units
Related Converters & Charts
Temperature Conversion Chart FAQs
Common questions about the temperature conversion chart.
What does this temperature conversion chart include?
It lists the most common temperature units side by side with their conversion factors, plus a free printable PDF you can download for offline reference.
What exact definition is this temperature chart based on?
K = °C + 273.15 and °F = °C × 9/5 + 32 (exact). Formula: °F = (°C × 1.8) + 32; K = °C + 273.15. Values are rounded to 2 decimal places.
Can I download this chart as a PDF, CSV, or JSON?
Yes. Use the Download A4 PDF or US Letter PDF buttons for a printable version, or download the same tables as CSV or JSON from the links on this page.