
Decibel Chart: Sound Levels and Exposure Limits
Decibels to sound pressure and intensity, how levels add and fall with distance, A-weighting by frequency, and how long you can be exposed to each level under the NIOSH and OSHA limits.
Standards and method
Pressures, intensities, level sums, distance losses, A-weighting and exposure times are calculated from their defining formulas (IEC 61672-1, NIOSH, OSHA 29 CFR 1910.95); typical levels are approximate.
Maintained by Miguel Coelho. Updated . See our editorial policy.
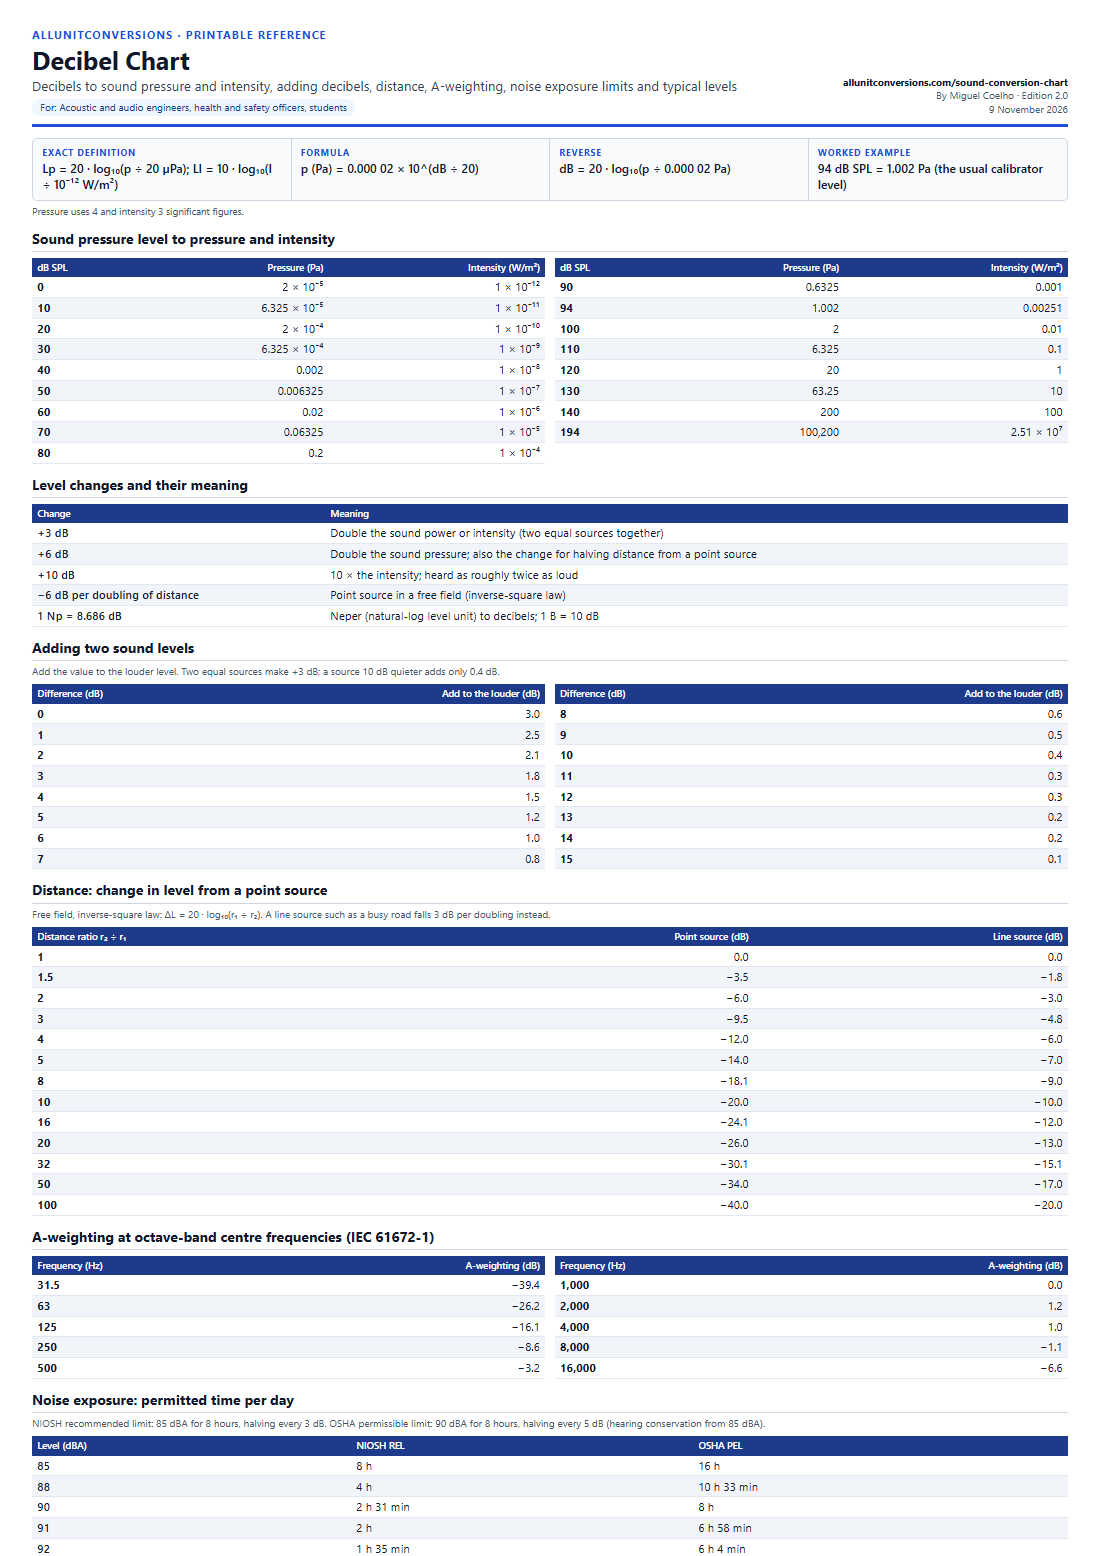
Printable decibel chart
Decibels to sound pressure and intensity, adding decibels, distance, A-weighting, noise exposure limits and typical levels. Includes the exact definition, formulas, a worked example and sources. Conversion values are checked against the defining constants, and reference data is cited to its source, before the PDF is published.
Free to print, share and use in teaching materials with attribution (CC BY 4.0).
Full decibel chart
Decibels to sound pressure and intensity, adding decibels, distance, A-weighting, noise exposure limits and typical levels. These are the same tables as the printable PDF. For: Acoustic and audio engineers, health and safety officers, students.
- Exact definition
- Lp = 20 · log₁₀(p ÷ 20 µPa); LI = 10 · log₁₀(I ÷ 10⁻¹² W/m²)
- Formula
- p (Pa) = 0.000 02 × 10^(dB ÷ 20)
- Reverse
- dB = 20 · log₁₀(p ÷ 0.000 02 Pa)
- Worked example
- 94 dB SPL = 1.002 Pa (the usual calibrator level)
- Rounding
- Pressure uses 4 and intensity 3 significant figures.
Sound pressure level to pressure and intensity
| dB SPL | Pressure (Pa) | Intensity (W/m²) |
|---|---|---|
| 0 | 2 × 10⁻⁵ | 1 × 10⁻¹² |
| 10 | 6.325 × 10⁻⁵ | 1 × 10⁻¹¹ |
| 20 | 2 × 10⁻⁴ | 1 × 10⁻¹⁰ |
| 30 | 6.325 × 10⁻⁴ | 1 × 10⁻⁹ |
| 40 | 0.002 | 1 × 10⁻⁸ |
| 50 | 0.006325 | 1 × 10⁻⁷ |
| 60 | 0.02 | 1 × 10⁻⁶ |
| 70 | 0.06325 | 1 × 10⁻⁵ |
| 80 | 0.2 | 1 × 10⁻⁴ |
| dB SPL | Pressure (Pa) | Intensity (W/m²) |
|---|---|---|
| 90 | 0.6325 | 0.001 |
| 94 | 1.002 | 0.00251 |
| 100 | 2 | 0.01 |
| 110 | 6.325 | 0.1 |
| 120 | 20 | 1 |
| 130 | 63.25 | 10 |
| 140 | 200 | 100 |
| 194 | 100,200 | 2.51 × 10⁷ |
Level changes and their meaning
| Change | Meaning |
|---|---|
| +3 dB | Double the sound power or intensity (two equal sources together) |
| +6 dB | Double the sound pressure; also the change for halving distance from a point source |
| +10 dB | 10 × the intensity; heard as roughly twice as loud |
| −6 dB per doubling of distance | Point source in a free field (inverse-square law) |
| 1 Np = 8.686 dB | Neper (natural-log level unit) to decibels; 1 B = 10 dB |
Adding two sound levels
Add the value to the louder level. Two equal sources make +3 dB; a source 10 dB quieter adds only 0.4 dB.
| Difference (dB) | Add to the louder (dB) |
|---|---|
| 0 | 3.0 |
| 1 | 2.5 |
| 2 | 2.1 |
| 3 | 1.8 |
| 4 | 1.5 |
| 5 | 1.2 |
| 6 | 1.0 |
| 7 | 0.8 |
| Difference (dB) | Add to the louder (dB) |
|---|---|
| 8 | 0.6 |
| 9 | 0.5 |
| 10 | 0.4 |
| 11 | 0.3 |
| 12 | 0.3 |
| 13 | 0.2 |
| 14 | 0.2 |
| 15 | 0.1 |
Distance: change in level from a point source
Free field, inverse-square law: ΔL = 20 · log₁₀(r₁ ÷ r₂). A line source such as a busy road falls 3 dB per doubling instead.
| Distance ratio r₂ ÷ r₁ | Point source (dB) | Line source (dB) |
|---|---|---|
| 1 | 0.0 | 0.0 |
| 1.5 | −3.5 | −1.8 |
| 2 | −6.0 | −3.0 |
| 3 | −9.5 | −4.8 |
| 4 | −12.0 | −6.0 |
| 5 | −14.0 | −7.0 |
| 8 | −18.1 | −9.0 |
| 10 | −20.0 | −10.0 |
| 16 | −24.1 | −12.0 |
| 20 | −26.0 | −13.0 |
| 32 | −30.1 | −15.1 |
| 50 | −34.0 | −17.0 |
| 100 | −40.0 | −20.0 |
A-weighting at octave-band centre frequencies (IEC 61672-1)
| Frequency (Hz) | A-weighting (dB) |
|---|---|
| 31.5 | −39.4 |
| 63 | −26.2 |
| 125 | −16.1 |
| 250 | −8.6 |
| 500 | −3.2 |
| Frequency (Hz) | A-weighting (dB) |
|---|---|
| 1,000 | 0.0 |
| 2,000 | 1.2 |
| 4,000 | 1.0 |
| 8,000 | −1.1 |
| 16,000 | −6.6 |
Noise exposure: permitted time per day
NIOSH recommended limit: 85 dBA for 8 hours, halving every 3 dB. OSHA permissible limit: 90 dBA for 8 hours, halving every 5 dB (hearing conservation from 85 dBA).
| Level (dBA) | NIOSH REL | OSHA PEL |
|---|---|---|
| 85 | 8 h | 16 h |
| 88 | 4 h | 10 h 33 min |
| 90 | 2 h 31 min | 8 h |
| 91 | 2 h | 6 h 58 min |
| 92 | 1 h 35 min | 6 h 4 min |
| 94 | 1 h | 4 h 36 min |
| 95 | 48 min | 4 h |
| 97 | 30 min | 3 h 2 min |
| 100 | 15 min | 2 h |
| 102 | 9 min 27 s | 1 h 31 min |
| 103 | 7 min 30 s | 1 h 19 min |
| 105 | 4 min 43 s | 1 h |
| 110 | 1 min 29 s | 30 min |
| 115 | 28 s | 15 min |
Typical sound levels and workplace limits
| Source or limit | Level |
|---|---|
| Threshold of hearing | 0 dB |
| Quiet bedroom at night | ≈ 30 dB(A) |
| Normal conversation at 1 m | ≈ 60 dB(A) |
| UK lower exposure action value (daily) | 80 dB(A) |
| UK upper exposure action value (daily) | 85 dB(A) |
| UK exposure limit value (daily, with hearing protection) | 87 dB(A) |
| Rock concert near speakers | ≈ 110 dB(A) |
| Threshold of pain | ≈ 120–130 dB |
Sources for this chart
Pressures, intensities, level sums, distance losses, A-weighting and exposure times are calculated from their defining formulas (IEC 61672-1, NIOSH, OSHA 29 CFR 1910.95); typical levels are approximate.
- NIST Special Publication 811 — Guide for the Use of the International System of Units
- UK Control of Noise at Work Regulations 2005 — Exposure action values 80 / 85 dB(A), limit 87 dB(A)
- IEC 61672-1:2013 — Electroacoustics, sound level meters: frequency weighting A
- NIOSH, Criteria for a Recommended Standard: Occupational Noise Exposure (1998) — REL 85 dBA as an 8-hour TWA with a 3 dB exchange rate
- OSHA 29 CFR 1910.95 — PEL 90 dBA for 8 hours with a 5 dB exchange rate (Table G-16 and Appendix A)
Related Converters & Charts
Decibel Chart: Sound Levels and Exposure Limits FAQs
Common questions about the decibel chart.
How do you add decibels?
Decibels add logarithmically: L = 10 · log₁₀(10^(L₁/10) + 10^(L₂/10)). Two equal sources add 3 dB (80 dB + 80 dB = 83 dB); a source 10 dB quieter adds only 0.4 dB.
How long can you be exposed to 100 dB?
NIOSH recommends no more than 15 minutes a day at 100 dBA (85 dBA for 8 hours, halving every 3 dB). The OSHA legal limit allows 2 hours (90 dBA for 8 hours, halving every 5 dB).
What is A-weighting?
A frequency weighting defined in IEC 61672-1 that follows the ear’s lower sensitivity to low and very high frequencies. At 63 Hz it subtracts 26.2 dB; at 1 kHz it is zero.
Can I download this chart as a PDF, CSV, or JSON?
Yes. Use the Download A4 PDF or US Letter PDF buttons for a printable version, or download the same tables as CSV or JSON from the links on this page.