
Radiation Dose Rate Chart (µSv/h, mrem/h, mR/h)
Quick-reference radiation dose rate conversion chart. The tables below compare the most common units side by side. Download the free PDF for offline and printable use.
Standards and method
Rate conversions follow from 1 Sv = 100 rem exactly; yearly totals use 8,766 hours; reference doses are quoted from the sources listed and converted to average rates.
Maintained by Miguel Coelho. Updated . See our editorial policy.
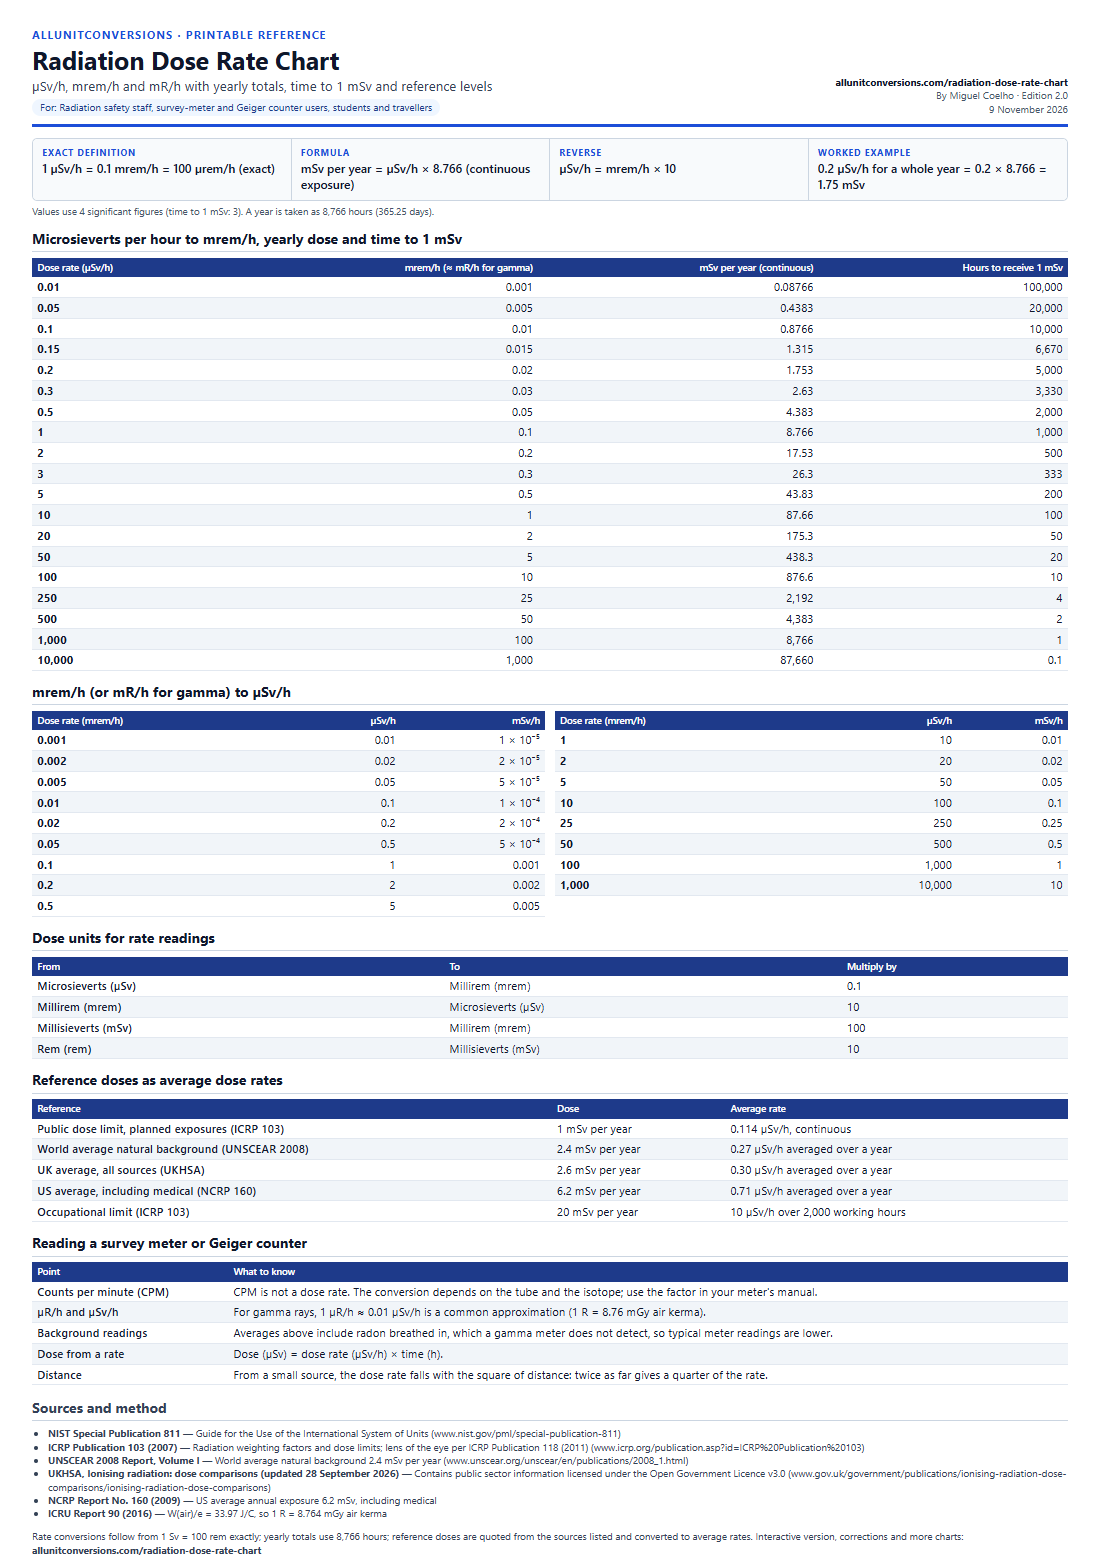
Printable radiation dose rate chart
µSv/h, mrem/h and mR/h with yearly totals, time to 1 mSv and reference levels. Includes the exact definition, formulas, a worked example and sources. Conversion values are checked against the defining constants, and reference data is cited to its source, before the PDF is published.
Free to print, share and use in teaching materials with attribution (CC BY 4.0).
Also in the Radiation Safety and Radiologic Technology Pack, with related sheets in one PDF.
Full radiation dose rate chart
µSv/h, mrem/h and mR/h with yearly totals, time to 1 mSv and reference levels. These are the same tables as the printable PDF. For: Radiation safety staff, survey-meter and Geiger counter users, students and travellers.
- Exact definition
- 1 µSv/h = 0.1 mrem/h = 100 µrem/h (exact)
- Formula
- mSv per year = µSv/h × 8.766 (continuous exposure)
- Reverse
- µSv/h = mrem/h × 10
- Worked example
- 0.2 µSv/h for a whole year = 0.2 × 8.766 = 1.75 mSv
- Rounding
- Values use 4 significant figures (time to 1 mSv: 3). A year is taken as 8,766 hours (365.25 days).
Microsieverts per hour to mrem/h, yearly dose and time to 1 mSv
| Dose rate (µSv/h) | mrem/h (≈ mR/h for gamma) | mSv per year (continuous) | Hours to receive 1 mSv |
|---|---|---|---|
| 0.01 | 0.001 | 0.08766 | 100,000 |
| 0.05 | 0.005 | 0.4383 | 20,000 |
| 0.1 | 0.01 | 0.8766 | 10,000 |
| 0.15 | 0.015 | 1.315 | 6,670 |
| 0.2 | 0.02 | 1.753 | 5,000 |
| 0.3 | 0.03 | 2.63 | 3,330 |
| 0.5 | 0.05 | 4.383 | 2,000 |
| 1 | 0.1 | 8.766 | 1,000 |
| 2 | 0.2 | 17.53 | 500 |
| 3 | 0.3 | 26.3 | 333 |
| 5 | 0.5 | 43.83 | 200 |
| 10 | 1 | 87.66 | 100 |
| 20 | 2 | 175.3 | 50 |
| 50 | 5 | 438.3 | 20 |
| 100 | 10 | 876.6 | 10 |
| 250 | 25 | 2,192 | 4 |
| 500 | 50 | 4,383 | 2 |
| 1,000 | 100 | 8,766 | 1 |
| 10,000 | 1,000 | 87,660 | 0.1 |
mrem/h (or mR/h for gamma) to µSv/h
| Dose rate (mrem/h) | µSv/h | mSv/h |
|---|---|---|
| 0.001 | 0.01 | 1 × 10⁻⁵ |
| 0.002 | 0.02 | 2 × 10⁻⁵ |
| 0.005 | 0.05 | 5 × 10⁻⁵ |
| 0.01 | 0.1 | 1 × 10⁻⁴ |
| 0.02 | 0.2 | 2 × 10⁻⁴ |
| 0.05 | 0.5 | 5 × 10⁻⁴ |
| 0.1 | 1 | 0.001 |
| 0.2 | 2 | 0.002 |
| 0.5 | 5 | 0.005 |
| Dose rate (mrem/h) | µSv/h | mSv/h |
|---|---|---|
| 1 | 10 | 0.01 |
| 2 | 20 | 0.02 |
| 5 | 50 | 0.05 |
| 10 | 100 | 0.1 |
| 25 | 250 | 0.25 |
| 50 | 500 | 0.5 |
| 100 | 1,000 | 1 |
| 1,000 | 10,000 | 10 |
Dose units for rate readings
| From | To | Multiply by |
|---|---|---|
| Microsieverts (µSv) | Millirem (mrem) | 0.1 |
| Millirem (mrem) | Microsieverts (µSv) | 10 |
| Millisieverts (mSv) | Millirem (mrem) | 100 |
| Rem (rem) | Millisieverts (mSv) | 10 |
Reference doses as average dose rates
| Reference | Dose | Average rate |
|---|---|---|
| Public dose limit, planned exposures (ICRP 103) | 1 mSv per year | 0.114 µSv/h, continuous |
| World average natural background (UNSCEAR 2008) | 2.4 mSv per year | 0.27 µSv/h averaged over a year |
| UK average, all sources (UKHSA) | 2.6 mSv per year | 0.30 µSv/h averaged over a year |
| US average, including medical (NCRP 160) | 6.2 mSv per year | 0.71 µSv/h averaged over a year |
| Occupational limit (ICRP 103) | 20 mSv per year | 10 µSv/h over 2,000 working hours |
Reading a survey meter or Geiger counter
| Point | What to know |
|---|---|
| Counts per minute (CPM) | CPM is not a dose rate. The conversion depends on the tube and the isotope; use the factor in your meter's manual. |
| µR/h and µSv/h | For gamma rays, 1 µR/h ≈ 0.01 µSv/h is a common approximation (1 R = 8.76 mGy air kerma). |
| Background readings | Averages above include radon breathed in, which a gamma meter does not detect, so typical meter readings are lower. |
| Dose from a rate | Dose (µSv) = dose rate (µSv/h) × time (h). |
| Distance | From a small source, the dose rate falls with the square of distance: twice as far gives a quarter of the rate. |
Sources for this chart
Rate conversions follow from 1 Sv = 100 rem exactly; yearly totals use 8,766 hours; reference doses are quoted from the sources listed and converted to average rates.
- NIST Special Publication 811 — Guide for the Use of the International System of Units
- ICRP Publication 103 (2007) — Radiation weighting factors and dose limits; lens of the eye per ICRP Publication 118 (2011)
- UNSCEAR 2008 Report, Volume I — World average natural background 2.4 mSv per year
- UKHSA, Ionising radiation: dose comparisons (updated 28 September 2026) — Contains public sector information licensed under the Open Government Licence v3.0
- NCRP Report No. 160 (2009) — US average annual exposure 6.2 mSv, including medical
- ICRU Report 90 (2016) — W(air)/e = 33.97 J/C, so 1 R = 8.764 mGy air kerma
Related Converters & Charts
Radiation Dose Rate Chart (µSv/h, mrem/h, mR/h) FAQs
Common questions about the radiation dose rate chart.
What does this radiation dose rate conversion chart include?
It lists the most common radiation dose rate units side by side with their conversion factors, plus a free printable PDF you can download for offline reference.
What exact definition is this radiation dose rate chart based on?
1 µSv/h = 0.1 mrem/h = 100 µrem/h (exact). Formula: mSv per year = µSv/h × 8.766 (continuous exposure). Values use 4 significant figures (time to 1 mSv: 3). A year is taken as 8,766 hours (365.25 days).
Can I download this chart as a PDF, CSV, or JSON?
Yes. Use the Download A4 PDF or US Letter PDF buttons for a printable version, or download the same tables as CSV or JSON from the links on this page.