
Radiation Dose Chart: X-ray, CT and Everyday Doses
Quick-reference radiation dose conversion chart. The tables below compare the most common units side by side. Download the free PDF for offline and printable use.
Standards and method
Doses are transcribed from the sources listed; the mrem, background-time and chest X-ray columns are calculated from them on the basis stated above each table.
Maintained by Miguel Coelho. Updated . See our editorial policy.
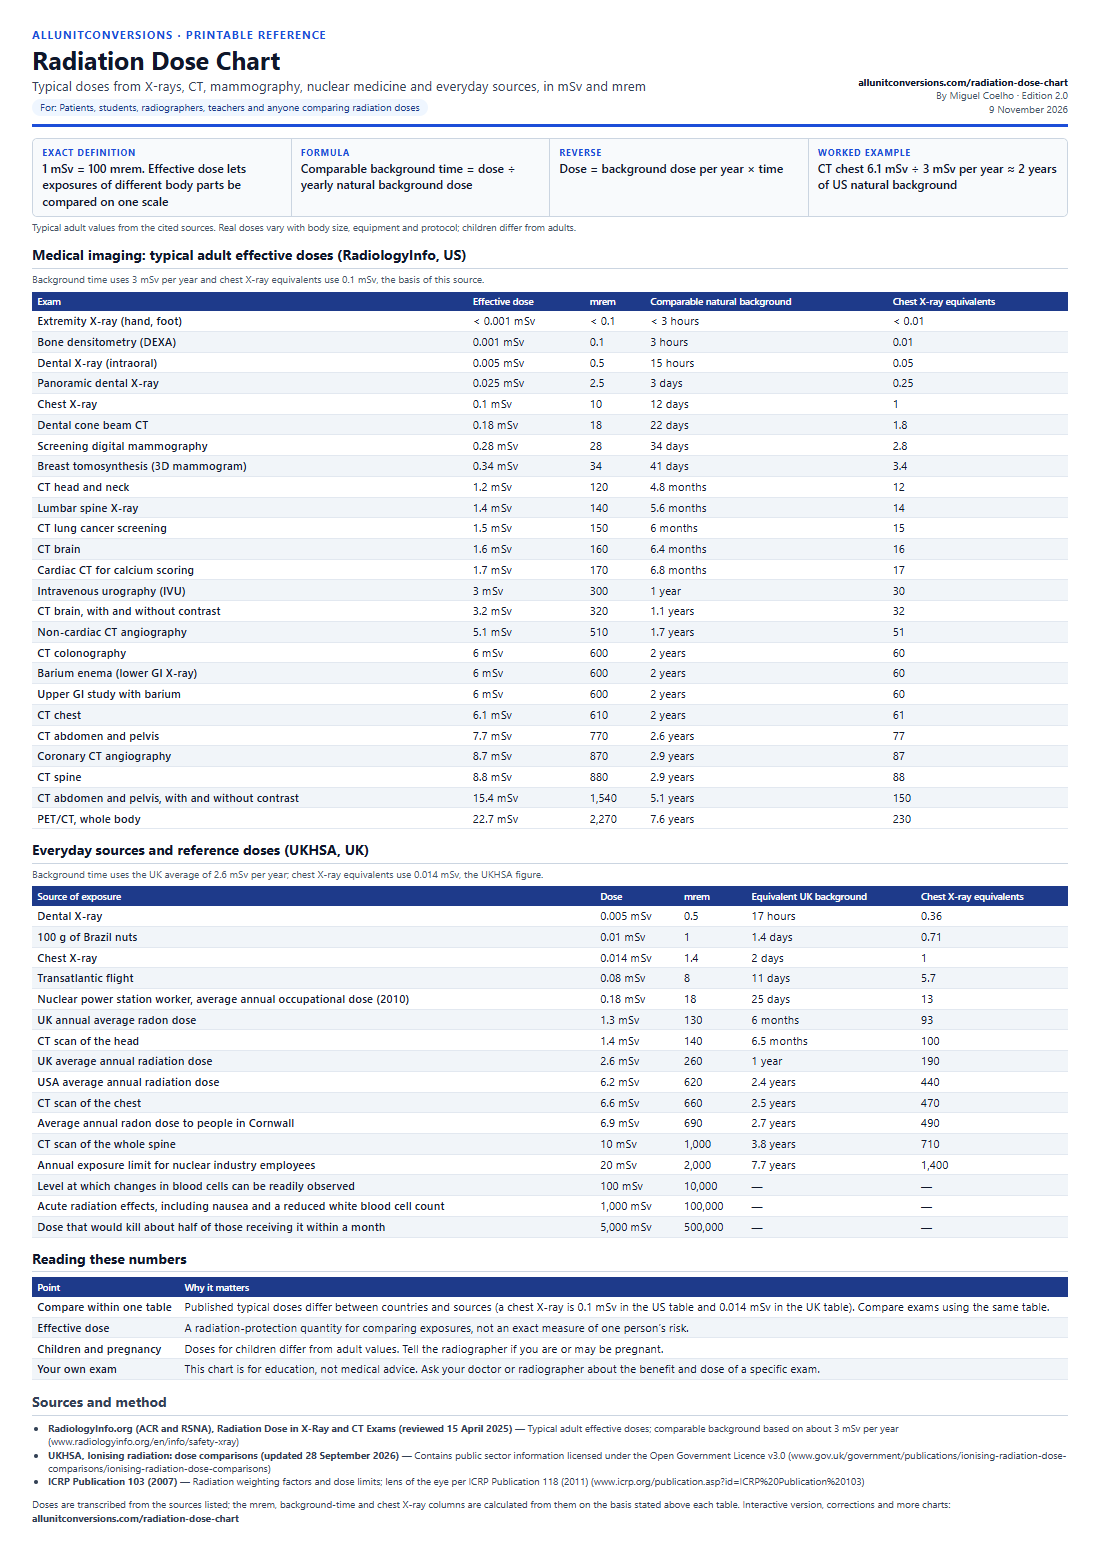
Printable radiation dose chart
Typical doses from X-rays, CT, mammography, nuclear medicine and everyday sources, in mSv and mrem. Includes the exact definition, formulas, a worked example and sources. Conversion values are checked against the defining constants, and reference data is cited to its source, before the PDF is published.
Free to print, share and use in teaching materials with attribution (CC BY 4.0).
Also in the Radiation Safety and Radiologic Technology Pack, with related sheets in one PDF.
Full radiation dose chart
Typical doses from X-rays, CT, mammography, nuclear medicine and everyday sources, in mSv and mrem. These are the same tables as the printable PDF. For: Patients, students, radiographers, teachers and anyone comparing radiation doses.
- Exact definition
- 1 mSv = 100 mrem. Effective dose lets exposures of different body parts be compared on one scale
- Formula
- Comparable background time = dose ÷ yearly natural background dose
- Reverse
- Dose = background dose per year × time
- Worked example
- CT chest 6.1 mSv ÷ 3 mSv per year ≈ 2 years of US natural background
- Rounding
- Typical adult values from the cited sources. Real doses vary with body size, equipment and protocol; children differ from adults.
Medical imaging: typical adult effective doses (RadiologyInfo, US)
Background time uses 3 mSv per year and chest X-ray equivalents use 0.1 mSv, the basis of this source.
| Exam | Effective dose | mrem | Comparable natural background | Chest X-ray equivalents |
|---|---|---|---|---|
| Extremity X-ray (hand, foot) | < 0.001 mSv | < 0.1 | < 3 hours | < 0.01 |
| Bone densitometry (DEXA) | 0.001 mSv | 0.1 | 3 hours | 0.01 |
| Dental X-ray (intraoral) | 0.005 mSv | 0.5 | 15 hours | 0.05 |
| Panoramic dental X-ray | 0.025 mSv | 2.5 | 3 days | 0.25 |
| Chest X-ray | 0.1 mSv | 10 | 12 days | 1 |
| Dental cone beam CT | 0.18 mSv | 18 | 22 days | 1.8 |
| Screening digital mammography | 0.28 mSv | 28 | 34 days | 2.8 |
| Breast tomosynthesis (3D mammogram) | 0.34 mSv | 34 | 41 days | 3.4 |
| CT head and neck | 1.2 mSv | 120 | 4.8 months | 12 |
| Lumbar spine X-ray | 1.4 mSv | 140 | 5.6 months | 14 |
| CT lung cancer screening | 1.5 mSv | 150 | 6 months | 15 |
| CT brain | 1.6 mSv | 160 | 6.4 months | 16 |
| Cardiac CT for calcium scoring | 1.7 mSv | 170 | 6.8 months | 17 |
| Intravenous urography (IVU) | 3 mSv | 300 | 1 year | 30 |
| CT brain, with and without contrast | 3.2 mSv | 320 | 1.1 years | 32 |
| Non-cardiac CT angiography | 5.1 mSv | 510 | 1.7 years | 51 |
| CT colonography | 6 mSv | 600 | 2 years | 60 |
| Barium enema (lower GI X-ray) | 6 mSv | 600 | 2 years | 60 |
| Upper GI study with barium | 6 mSv | 600 | 2 years | 60 |
| CT chest | 6.1 mSv | 610 | 2 years | 61 |
| CT abdomen and pelvis | 7.7 mSv | 770 | 2.6 years | 77 |
| Coronary CT angiography | 8.7 mSv | 870 | 2.9 years | 87 |
| CT spine | 8.8 mSv | 880 | 2.9 years | 88 |
| CT abdomen and pelvis, with and without contrast | 15.4 mSv | 1,540 | 5.1 years | 150 |
| PET/CT, whole body | 22.7 mSv | 2,270 | 7.6 years | 230 |
Everyday sources and reference doses (UKHSA, UK)
Background time uses the UK average of 2.6 mSv per year; chest X-ray equivalents use 0.014 mSv, the UKHSA figure.
| Source of exposure | Dose | mrem | Equivalent UK background | Chest X-ray equivalents |
|---|---|---|---|---|
| Dental X-ray | 0.005 mSv | 0.5 | 17 hours | 0.36 |
| 100 g of Brazil nuts | 0.01 mSv | 1 | 1.4 days | 0.71 |
| Chest X-ray | 0.014 mSv | 1.4 | 2 days | 1 |
| Transatlantic flight | 0.08 mSv | 8 | 11 days | 5.7 |
| Nuclear power station worker, average annual occupational dose (2010) | 0.18 mSv | 18 | 25 days | 13 |
| UK annual average radon dose | 1.3 mSv | 130 | 6 months | 93 |
| CT scan of the head | 1.4 mSv | 140 | 6.5 months | 100 |
| UK average annual radiation dose | 2.6 mSv | 260 | 1 year | 190 |
| USA average annual radiation dose | 6.2 mSv | 620 | 2.4 years | 440 |
| CT scan of the chest | 6.6 mSv | 660 | 2.5 years | 470 |
| Average annual radon dose to people in Cornwall | 6.9 mSv | 690 | 2.7 years | 490 |
| CT scan of the whole spine | 10 mSv | 1,000 | 3.8 years | 710 |
| Annual exposure limit for nuclear industry employees | 20 mSv | 2,000 | 7.7 years | 1,400 |
| Level at which changes in blood cells can be readily observed | 100 mSv | 10,000 | — | — |
| Acute radiation effects, including nausea and a reduced white blood cell count | 1,000 mSv | 100,000 | — | — |
| Dose that would kill about half of those receiving it within a month | 5,000 mSv | 500,000 | — | — |
Reading these numbers
| Point | Why it matters |
|---|---|
| Compare within one table | Published typical doses differ between countries and sources (a chest X-ray is 0.1 mSv in the US table and 0.014 mSv in the UK table). Compare exams using the same table. |
| Effective dose | A radiation-protection quantity for comparing exposures, not an exact measure of one person’s risk. |
| Children and pregnancy | Doses for children differ from adult values. Tell the radiographer if you are or may be pregnant. |
| Your own exam | This chart is for education, not medical advice. Ask your doctor or radiographer about the benefit and dose of a specific exam. |
Sources for this chart
Doses are transcribed from the sources listed; the mrem, background-time and chest X-ray columns are calculated from them on the basis stated above each table.
- RadiologyInfo.org (ACR and RSNA), Radiation Dose in X-Ray and CT Exams (reviewed 15 April 2025) — Typical adult effective doses; comparable background based on about 3 mSv per year
- UKHSA, Ionising radiation: dose comparisons (updated 28 September 2026) — Contains public sector information licensed under the Open Government Licence v3.0
- ICRP Publication 103 (2007) — Radiation weighting factors and dose limits; lens of the eye per ICRP Publication 118 (2011)
Related Converters & Charts
Radiation Dose Chart: X-ray, CT and Everyday Doses FAQs
Common questions about the radiation dose chart.
What does this radiation dose conversion chart include?
It lists the most common radiation dose units side by side with their conversion factors, plus a free printable PDF you can download for offline reference.
What exact definition is this radiation dose chart based on?
1 mSv = 100 mrem. Effective dose lets exposures of different body parts be compared on one scale. Formula: Comparable background time = dose ÷ yearly natural background dose. Typical adult values from the cited sources. Real doses vary with body size, equipment and protocol; children differ from adults.
Can I download this chart as a PDF, CSV, or JSON?
Yes. Use the Download A4 PDF or US Letter PDF buttons for a printable version, or download the same tables as CSV or JSON from the links on this page.