
Nuclear Medicine Decay and Activity Chart
Quick-reference nuclear medicine decay conversion chart. The tables below compare the most common units side by side. Download the free PDF for offline and printable use.
Standards and method
Decay factors are calculated as 2^(−t ÷ T½) from the half-lives listed; mCi ↔ MBq uses 1 mCi = 37 MBq exactly.
Maintained by Miguel Coelho. Updated . See our editorial policy.
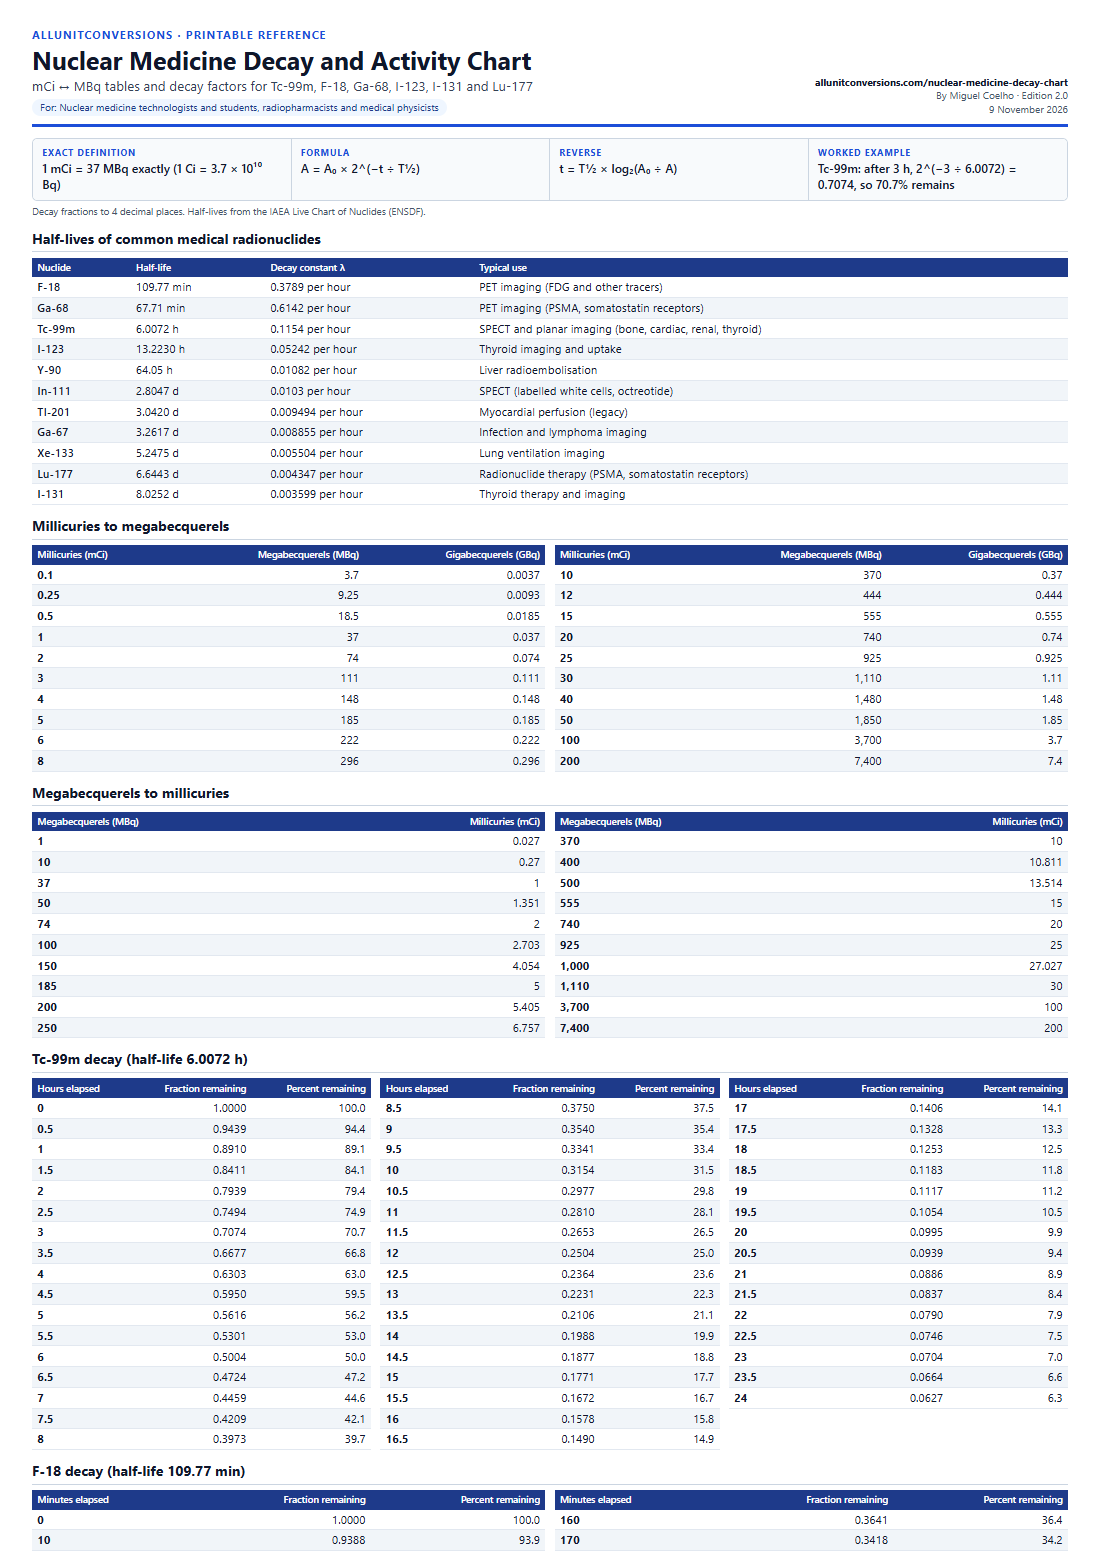
Printable nuclear medicine decay chart
mCi ↔ MBq tables and decay factors for Tc-99m, F-18, Ga-68, I-123, I-131 and Lu-177. Includes the exact definition, formulas, a worked example and sources. Conversion values are checked against the defining constants, and reference data is cited to its source, before the PDF is published.
Free to print, share and use in teaching materials with attribution (CC BY 4.0).
Also in the Radiation Safety and Radiologic Technology Pack, with related sheets in one PDF.
Full nuclear medicine decay chart
mCi ↔ MBq tables and decay factors for Tc-99m, F-18, Ga-68, I-123, I-131 and Lu-177. These are the same tables as the printable PDF. For: Nuclear medicine technologists and students, radiopharmacists and medical physicists.
- Exact definition
- 1 mCi = 37 MBq exactly (1 Ci = 3.7 × 10¹⁰ Bq)
- Formula
- A = A₀ × 2^(−t ÷ T½)
- Reverse
- t = T½ × log₂(A₀ ÷ A)
- Worked example
- Tc-99m: after 3 h, 2^(−3 ÷ 6.0072) = 0.7074, so 70.7% remains
- Rounding
- Decay fractions to 4 decimal places. Half-lives from the IAEA Live Chart of Nuclides (ENSDF).
Half-lives of common medical radionuclides
| Nuclide | Half-life | Decay constant λ | Typical use |
|---|---|---|---|
| F-18 | 109.77 min | 0.3789 per hour | PET imaging (FDG and other tracers) |
| Ga-68 | 67.71 min | 0.6142 per hour | PET imaging (PSMA, somatostatin receptors) |
| Tc-99m | 6.0072 h | 0.1154 per hour | SPECT and planar imaging (bone, cardiac, renal, thyroid) |
| I-123 | 13.2230 h | 0.05242 per hour | Thyroid imaging and uptake |
| Y-90 | 64.05 h | 0.01082 per hour | Liver radioembolisation |
| In-111 | 2.8047 d | 0.0103 per hour | SPECT (labelled white cells, octreotide) |
| Tl-201 | 3.0420 d | 0.009494 per hour | Myocardial perfusion (legacy) |
| Ga-67 | 3.2617 d | 0.008855 per hour | Infection and lymphoma imaging |
| Xe-133 | 5.2475 d | 0.005504 per hour | Lung ventilation imaging |
| Lu-177 | 6.6443 d | 0.004347 per hour | Radionuclide therapy (PSMA, somatostatin receptors) |
| I-131 | 8.0252 d | 0.003599 per hour | Thyroid therapy and imaging |
Millicuries to megabecquerels
| Millicuries (mCi) | Megabecquerels (MBq) | Gigabecquerels (GBq) |
|---|---|---|
| 0.1 | 3.7 | 0.0037 |
| 0.25 | 9.25 | 0.0093 |
| 0.5 | 18.5 | 0.0185 |
| 1 | 37 | 0.037 |
| 2 | 74 | 0.074 |
| 3 | 111 | 0.111 |
| 4 | 148 | 0.148 |
| 5 | 185 | 0.185 |
| 6 | 222 | 0.222 |
| 8 | 296 | 0.296 |
| Millicuries (mCi) | Megabecquerels (MBq) | Gigabecquerels (GBq) |
|---|---|---|
| 10 | 370 | 0.37 |
| 12 | 444 | 0.444 |
| 15 | 555 | 0.555 |
| 20 | 740 | 0.74 |
| 25 | 925 | 0.925 |
| 30 | 1,110 | 1.11 |
| 40 | 1,480 | 1.48 |
| 50 | 1,850 | 1.85 |
| 100 | 3,700 | 3.7 |
| 200 | 7,400 | 7.4 |
Megabecquerels to millicuries
| Megabecquerels (MBq) | Millicuries (mCi) |
|---|---|
| 1 | 0.027 |
| 10 | 0.27 |
| 37 | 1 |
| 50 | 1.351 |
| 74 | 2 |
| 100 | 2.703 |
| 150 | 4.054 |
| 185 | 5 |
| 200 | 5.405 |
| 250 | 6.757 |
| Megabecquerels (MBq) | Millicuries (mCi) |
|---|---|
| 370 | 10 |
| 400 | 10.811 |
| 500 | 13.514 |
| 555 | 15 |
| 740 | 20 |
| 925 | 25 |
| 1,000 | 27.027 |
| 1,110 | 30 |
| 3,700 | 100 |
| 7,400 | 200 |
Tc-99m decay (half-life 6.0072 h)
| Hours elapsed | Fraction remaining | Percent remaining |
|---|---|---|
| 0 | 1.0000 | 100.0 |
| 0.5 | 0.9439 | 94.4 |
| 1 | 0.8910 | 89.1 |
| 1.5 | 0.8411 | 84.1 |
| 2 | 0.7939 | 79.4 |
| 2.5 | 0.7494 | 74.9 |
| 3 | 0.7074 | 70.7 |
| 3.5 | 0.6677 | 66.8 |
| 4 | 0.6303 | 63.0 |
| 4.5 | 0.5950 | 59.5 |
| 5 | 0.5616 | 56.2 |
| 5.5 | 0.5301 | 53.0 |
| 6 | 0.5004 | 50.0 |
| 6.5 | 0.4724 | 47.2 |
| 7 | 0.4459 | 44.6 |
| 7.5 | 0.4209 | 42.1 |
| 8 | 0.3973 | 39.7 |
| Hours elapsed | Fraction remaining | Percent remaining |
|---|---|---|
| 8.5 | 0.3750 | 37.5 |
| 9 | 0.3540 | 35.4 |
| 9.5 | 0.3341 | 33.4 |
| 10 | 0.3154 | 31.5 |
| 10.5 | 0.2977 | 29.8 |
| 11 | 0.2810 | 28.1 |
| 11.5 | 0.2653 | 26.5 |
| 12 | 0.2504 | 25.0 |
| 12.5 | 0.2364 | 23.6 |
| 13 | 0.2231 | 22.3 |
| 13.5 | 0.2106 | 21.1 |
| 14 | 0.1988 | 19.9 |
| 14.5 | 0.1877 | 18.8 |
| 15 | 0.1771 | 17.7 |
| 15.5 | 0.1672 | 16.7 |
| 16 | 0.1578 | 15.8 |
| 16.5 | 0.1490 | 14.9 |
| Hours elapsed | Fraction remaining | Percent remaining |
|---|---|---|
| 17 | 0.1406 | 14.1 |
| 17.5 | 0.1328 | 13.3 |
| 18 | 0.1253 | 12.5 |
| 18.5 | 0.1183 | 11.8 |
| 19 | 0.1117 | 11.2 |
| 19.5 | 0.1054 | 10.5 |
| 20 | 0.0995 | 9.9 |
| 20.5 | 0.0939 | 9.4 |
| 21 | 0.0886 | 8.9 |
| 21.5 | 0.0837 | 8.4 |
| 22 | 0.0790 | 7.9 |
| 22.5 | 0.0746 | 7.5 |
| 23 | 0.0704 | 7.0 |
| 23.5 | 0.0664 | 6.6 |
| 24 | 0.0627 | 6.3 |
F-18 decay (half-life 109.77 min)
| Minutes elapsed | Fraction remaining | Percent remaining |
|---|---|---|
| 0 | 1.0000 | 100.0 |
| 10 | 0.9388 | 93.9 |
| 20 | 0.8814 | 88.1 |
| 30 | 0.8274 | 82.7 |
| 40 | 0.7768 | 77.7 |
| 50 | 0.7293 | 72.9 |
| 60 | 0.6846 | 68.5 |
| 70 | 0.6427 | 64.3 |
| 80 | 0.6034 | 60.3 |
| 90 | 0.5665 | 56.6 |
| 100 | 0.5318 | 53.2 |
| 110 | 0.4993 | 49.9 |
| 120 | 0.4687 | 46.9 |
| 130 | 0.4400 | 44.0 |
| 140 | 0.4131 | 41.3 |
| 150 | 0.3878 | 38.8 |
| Minutes elapsed | Fraction remaining | Percent remaining |
|---|---|---|
| 160 | 0.3641 | 36.4 |
| 170 | 0.3418 | 34.2 |
| 180 | 0.3209 | 32.1 |
| 190 | 0.3013 | 30.1 |
| 200 | 0.2828 | 28.3 |
| 210 | 0.2655 | 26.6 |
| 220 | 0.2493 | 24.9 |
| 230 | 0.2340 | 23.4 |
| 240 | 0.2197 | 22.0 |
| 250 | 0.2063 | 20.6 |
| 260 | 0.1936 | 19.4 |
| 270 | 0.1818 | 18.2 |
| 280 | 0.1707 | 17.1 |
| 290 | 0.1602 | 16.0 |
| 300 | 0.1504 | 15.0 |
Ga-68 decay (half-life 67.71 min)
| Minutes elapsed | Fraction remaining | Percent remaining |
|---|---|---|
| 0 | 1.0000 | 100.0 |
| 10 | 0.9027 | 90.3 |
| 20 | 0.8149 | 81.5 |
| 30 | 0.7356 | 73.6 |
| 40 | 0.6640 | 66.4 |
| 50 | 0.5994 | 59.9 |
| 60 | 0.5411 | 54.1 |
| 70 | 0.4884 | 48.8 |
| 80 | 0.4409 | 44.1 |
| 90 | 0.3980 | 39.8 |
| 100 | 0.3593 | 35.9 |
| 110 | 0.3243 | 32.4 |
| 120 | 0.2927 | 29.3 |
| Minutes elapsed | Fraction remaining | Percent remaining |
|---|---|---|
| 130 | 0.2643 | 26.4 |
| 140 | 0.2385 | 23.9 |
| 150 | 0.2153 | 21.5 |
| 160 | 0.1944 | 19.4 |
| 170 | 0.1755 | 17.5 |
| 180 | 0.1584 | 15.8 |
| 190 | 0.1430 | 14.3 |
| 200 | 0.1291 | 12.9 |
| 210 | 0.1165 | 11.7 |
| 220 | 0.1052 | 10.5 |
| 230 | 0.0949 | 9.5 |
| 240 | 0.0857 | 8.6 |
I-123 decay (half-life 13.2230 h)
| Hours elapsed | Fraction remaining | Percent remaining |
|---|---|---|
| 0 | 1.0000 | 100.0 |
| 2 | 0.9005 | 90.0 |
| 4 | 0.8108 | 81.1 |
| 6 | 0.7301 | 73.0 |
| 8 | 0.6575 | 65.7 |
| 10 | 0.5920 | 59.2 |
| 12 | 0.5331 | 53.3 |
| 14 | 0.4800 | 48.0 |
| 16 | 0.4323 | 43.2 |
| 18 | 0.3892 | 38.9 |
| 20 | 0.3505 | 35.0 |
| 22 | 0.3156 | 31.6 |
| 24 | 0.2842 | 28.4 |
| Hours elapsed | Fraction remaining | Percent remaining |
|---|---|---|
| 26 | 0.2559 | 25.6 |
| 28 | 0.2304 | 23.0 |
| 30 | 0.2075 | 20.8 |
| 32 | 0.1869 | 18.7 |
| 34 | 0.1683 | 16.8 |
| 36 | 0.1515 | 15.2 |
| 38 | 0.1364 | 13.6 |
| 40 | 0.1228 | 12.3 |
| 42 | 0.1106 | 11.1 |
| 44 | 0.0996 | 10.0 |
| 46 | 0.0897 | 9.0 |
| 48 | 0.0808 | 8.1 |
I-131 decay (half-life 8.0252 d)
| Days elapsed | Fraction remaining | Percent remaining |
|---|---|---|
| 0 | 1.0000 | 100.0 |
| 2 | 0.8414 | 84.1 |
| 4 | 0.7079 | 70.8 |
| 6 | 0.5956 | 59.6 |
| 8 | 0.5011 | 50.1 |
| 10 | 0.4216 | 42.2 |
| 12 | 0.3547 | 35.5 |
| 14 | 0.2984 | 29.8 |
| 16 | 0.2511 | 25.1 |
| 18 | 0.2113 | 21.1 |
| 20 | 0.1777 | 17.8 |
| 22 | 0.1495 | 15.0 |
| 24 | 0.1258 | 12.6 |
| 26 | 0.1059 | 10.6 |
| 28 | 0.0891 | 8.9 |
| Days elapsed | Fraction remaining | Percent remaining |
|---|---|---|
| 30 | 0.0749 | 7.5 |
| 32 | 0.0630 | 6.3 |
| 34 | 0.0530 | 5.3 |
| 36 | 0.0446 | 4.5 |
| 38 | 0.0375 | 3.8 |
| 40 | 0.0316 | 3.2 |
| 42 | 0.0266 | 2.7 |
| 44 | 0.0224 | 2.2 |
| 46 | 0.0188 | 1.9 |
| 48 | 0.0158 | 1.6 |
| 50 | 0.0133 | 1.3 |
| 52 | 0.0112 | 1.1 |
| 54 | 0.0094 | 0.9 |
| 56 | 0.0079 | 0.8 |
Lu-177 decay (half-life 6.6443 d)
| Days elapsed | Fraction remaining | Percent remaining |
|---|---|---|
| 0 | 1.0000 | 100.0 |
| 2 | 0.8117 | 81.2 |
| 4 | 0.6588 | 65.9 |
| 6 | 0.5348 | 53.5 |
| 8 | 0.4341 | 43.4 |
| 10 | 0.3523 | 35.2 |
| 12 | 0.2860 | 28.6 |
| 14 | 0.2321 | 23.2 |
| 16 | 0.1884 | 18.8 |
| 18 | 0.1529 | 15.3 |
| 20 | 0.1241 | 12.4 |
| Days elapsed | Fraction remaining | Percent remaining |
|---|---|---|
| 22 | 0.1008 | 10.1 |
| 24 | 0.0818 | 8.2 |
| 26 | 0.0664 | 6.6 |
| 28 | 0.0539 | 5.4 |
| 30 | 0.0437 | 4.4 |
| 32 | 0.0355 | 3.5 |
| 34 | 0.0288 | 2.9 |
| 36 | 0.0234 | 2.3 |
| 38 | 0.0190 | 1.9 |
| 40 | 0.0154 | 1.5 |
| 42 | 0.0125 | 1.3 |
Effective dose from an administered activity
| Step | Detail |
|---|---|
| Formula | Effective dose (mSv) = administered activity (MBq) × dose coefficient (mSv/MBq) |
| Coefficients | ICRP Publication 128 tabulates dose coefficients by radiopharmaceutical for adults and children. |
| Worked example | 370 MBq of F-18 FDG × 0.019 mSv/MBq (adult) = 7.0 mSv |
| Clinical use | For reference and teaching. Prescribe and verify activities with local protocols and a calibrated dose calibrator. |
Sources for this chart
Decay factors are calculated as 2^(−t ÷ T½) from the half-lives listed; mCi ↔ MBq uses 1 mCi = 37 MBq exactly.
- IAEA Live Chart of Nuclides (ENSDF evaluations, retrieved 9 November 2026) — Half-lives of the radionuclides listed
- NIST Special Publication 811 — Guide for the Use of the International System of Units
- ICRP Publication 128 (2015) — Radiation dose to patients from radiopharmaceuticals (dose coefficients)
Related Converters & Charts
Nuclear Medicine Decay and Activity Chart FAQs
Common questions about the nuclear medicine decay chart.
What does this nuclear medicine decay conversion chart include?
It lists the most common nuclear medicine decay units side by side with their conversion factors, plus a free printable PDF you can download for offline reference.
What exact definition is this nuclear medicine decay chart based on?
1 mCi = 37 MBq exactly (1 Ci = 3.7 × 10¹⁰ Bq). Formula: A = A₀ × 2^(−t ÷ T½). Decay fractions to 4 decimal places. Half-lives from the IAEA Live Chart of Nuclides (ENSDF).
Can I download this chart as a PDF, CSV, or JSON?
Yes. Use the Download A4 PDF or US Letter PDF buttons for a printable version, or download the same tables as CSV or JSON from the links on this page.